A strategy is easiest to trust immediately after a profitable backtest and hardest to trust after ten consecutive losses. That is precisely when an investor is most likely to replace rules with a story: the market has changed, the robot needs a new filter, the last signal was “obviously” wrong.
The better question is not “is the equity curve currently red?” It is:
The same drawdown can mean two different things
In a healthy trend-following system, losses often cluster while the market changes direction repeatedly. The strategy can look inactive or “wrong” for weeks, then recover when a persistent move appears. In a degraded system, the losses may look similar at first — but the recovery never arrives because the signal no longer separates favourable from unfavourable outcomes.
Start with the path, not the final return
Two systems can both return 14% over a test period. One may reach the result through frequent small gains and short pauses. The other may spend most of the period flat, lose six times in a row and make its year in two large trends. Their headline returns match; their psychological and operational requirements do not.
For a prop account, the path matters even more. A later recovery cannot undo an earlier daily-loss or maximum-drawdown breach. For a personal account, the same path may be acceptable if the capital and holding period were chosen for it. The system is not judged in isolation: it is judged against the environment in which it must survive.
A concrete example: RegimeBreak 5-20-60
The current PropQuant Lab MT5 research gives a useful example of why a single red number is not enough. In the XAUUSD long test at 0.50% initial risk, RegimeBreak produced 86 trades, a 50.0% win rate, $14,232.03 net profit, 1.86 profit factor and 2.73% maximum equity drawdown. Its worst losing streak was six trades.
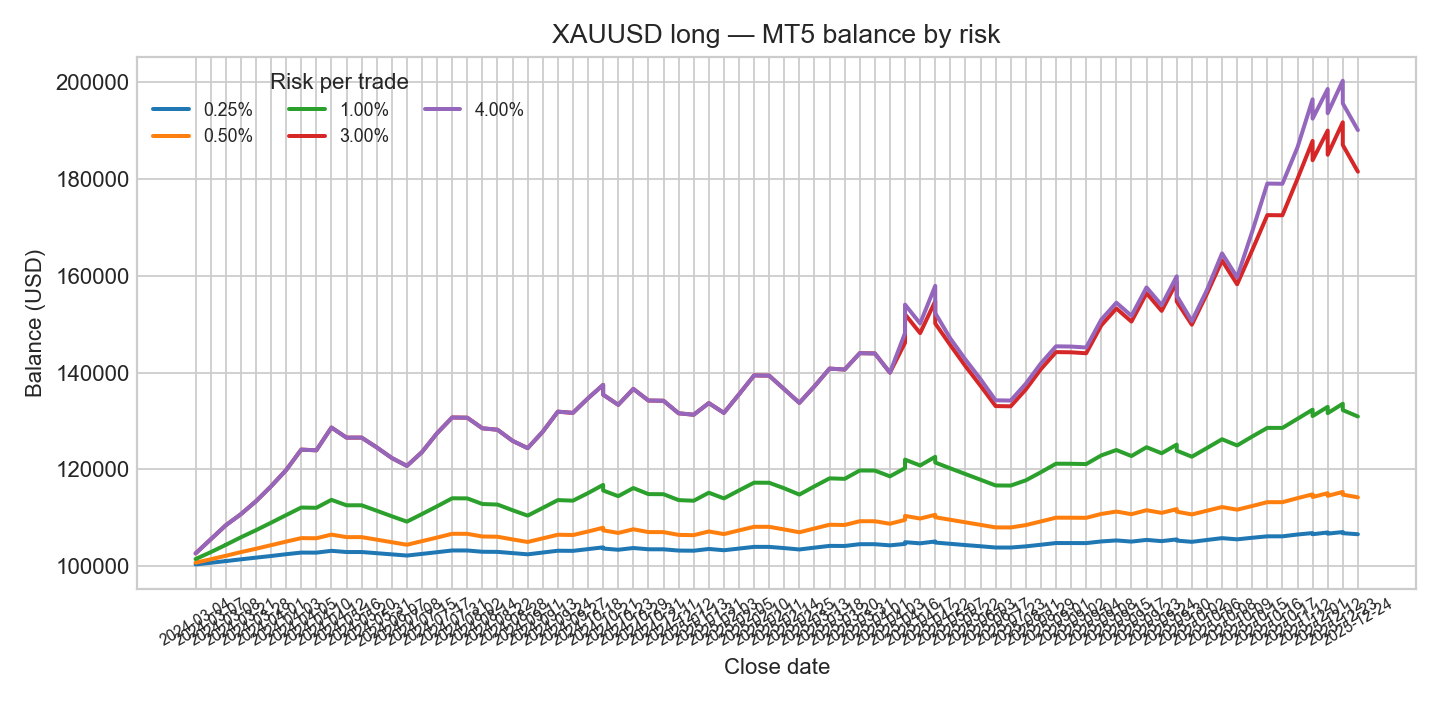
Now compare the same historical trade sequence at 4.00% risk. Net profit rises to $90,038.59, but maximum equity drawdown rises to 17.03%. Profit factor remains broadly similar at 1.87. The higher return is leverage applied to the same edge, not proof that the strategy became better.
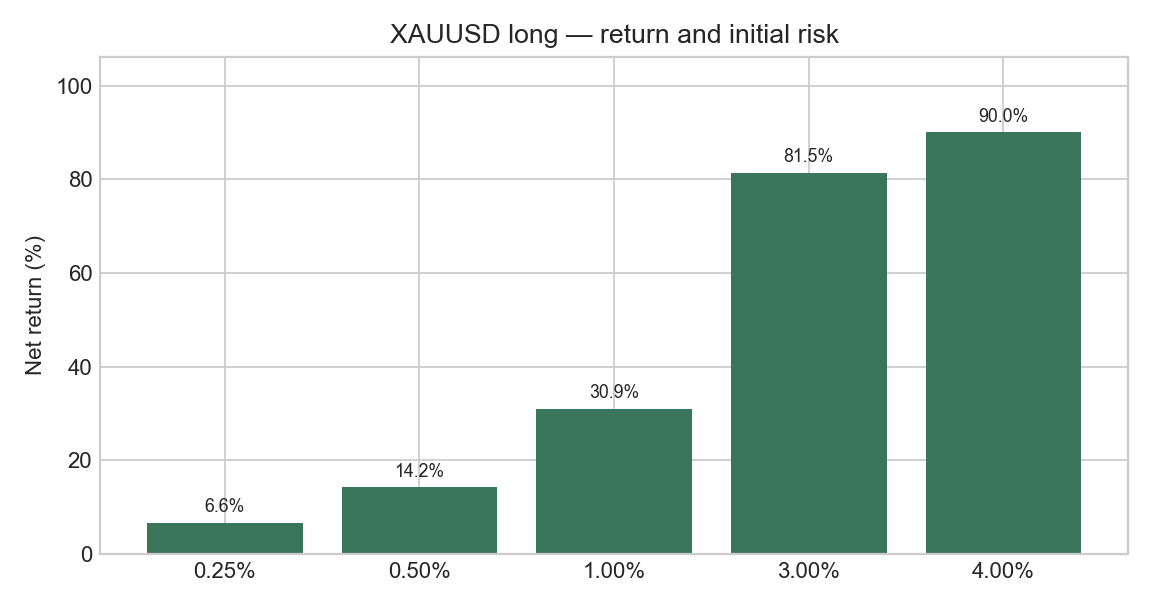
The test demonstrates a stable relationship between risk size and historical drawdown for this sample. It does not prove that the edge will persist, that intraday prop limits cannot be breached, or that 4.00% risk is operationally acceptable. Historical performance is evidence for a decision, not a forecast.
Five signals that deserve a review
1. The drawdown lasts outside its historical range
Depth is intuitive, so it attracts too much attention. Duration is often more informative. If the longest historical period from peak equity to recovery was 90 trading days and the live strategy has been underwater for 180 days, that is a review trigger even if the drawdown percentage is modest.
Do not set a universal “90 days means dead” rule. Estimate the distribution of historical drawdown durations, then compare live time-underwater with a conservative percentile. A trend system may have an ugly quarter and still be healthy; it should not be allowed to drift indefinitely without a defined escalation path.
2. Rolling expectancy turns negative on a meaningful sample
Track the average net result per trade over a rolling window, including commission, spread and swap:
A negative 20-trade window is not automatically a failure. It may be one bad cluster. A negative rolling expectancy across several consecutive windows, especially when the live distribution is materially worse than the out-of-sample distribution, is a stronger signal.
3. The trade distribution changes, not just the total P&L
Monitor the shape of the results:
- win rate and average win/loss;
- loss-streak and holding-time distribution;
- profit concentration by month, symbol and direction;
- number of signals and missed/blocked executions;
- relationship between signal quality and market regime.
For example, if a trend-following system historically earned from a small number of long-running winners, a temporary lack of winners is not surprising. But if winners still occur while their average size collapses, or if losers become larger because exits are no longer filled as tested, the problem may be execution or a changed market microstructure.
4. Live execution drifts away from the research model
A strategy can “break” operationally while its market idea remains valid. Compare the live log with the test on the fields that can actually change the result:
| Check | Research assumption | Live warning |
|---|---|---|
| Spread | Broker/tester spread or fixed estimate | Observed spread regularly exceeds the reserve |
| Slippage | Entry and exit at a reproducible price | Fills move the average trade below expectancy |
| Symbol | Contract size, tick value and session are known | Broker specification or trading hours changed |
| Timing | Signal evaluated on the intended bar | Timezone, rollover or bar-close logic differs |
| Risk | Volume rounded as in the tester | Minimum lot or margin changes actual risk |
The RegimeBreak research itself states an important limitation: the prop replay uses closed-deal P&L and does not reconstruct intraday open-equity drawdown. That is not a flaw to hide; it is a boundary around the conclusion. A monitoring article should make the same boundaries explicit.
5. Independent validation windows fail together
A backtest can contain a lucky regime. Divide research into development, out-of-sample and forward periods. If one window fails, investigate. If several non-overlapping windows fail under realistic costs, the burden of proof changes: stop searching for a new parameter and ask whether the premise still makes sense.
What is not enough to declare a strategy dead
These events are uncomfortable, but they are weak evidence on their own:
- one losing month;
- a six-trade losing streak when six losses were present in research;
- no trades for several weeks when the rules correctly say “no signal”;
- one symbol failing with only three trades;
- a lower return after reducing risk;
- a strategy underperforming a different strategy in a different regime.
RegimeBreak’s XAUUSD short test is a good cautionary example: it ended with a 0.02 profit factor, but it contained only three trades. That is enough to say “this sample does not support the short side.” It is not enough to estimate a robust long-run failure probability. Small samples create both false confidence and false pessimism.
A practical monitoring protocol
The solution is to decide in advance what gets measured, how often, and what action follows. The thresholds below are an example framework, not a universal law.
| State | Evidence | Action |
|---|---|---|
| Normal | Drawdown and streak remain inside the historical range; execution is in tolerance. | Continue at planned risk. Do not optimise. |
| Watch | Time underwater exceeds the historical median or rolling results weaken. | Keep collecting data; review costs, timing and regime exposure. |
| Reduce | Live drawdown approaches the stress limit or several rolling windows are negative. | Reduce risk and pause new capital until the review is complete. |
| Quarantine | Execution mismatch, code discrepancy or repeated OOS failure. | Stop live deployment; reproduce the issue in a controlled test. |
| Archive | The premise fails after realistic costs across independent periods. | Retire the version. Preserve the log and write down why. |
The monthly review template
A compact monthly report can contain enough information to prevent emotional decisions:
- Equity: current drawdown, time underwater and distance to the previous high.
- Trades: count, expectancy, profit factor, win/loss size and streaks.
- Execution: spread, slippage, rejected orders, latency and symbol changes.
- Regime: market direction, volatility and the conditions under which the strategy is expected to be quiet.
- Decision: continue, watch, reduce, quarantine or archive — with a reason.
The most important field is the last one. If the only action is “change the parameters until the curve looks better,” the review has turned into overfitting. A good process allows the system to be wrong and preserves the evidence when it is.
Final rule: do not confuse discomfort with information
A strategy can be profitable and still be unsuitable for a particular account. It can also be in a drawdown and still be behaving exactly as researched. The task is to define the operating envelope before the next uncomfortable period arrives.
For RegimeBreak, that means separating at least four questions: does the signal still produce an edge, does the broker execute it as tested, can the chosen risk survive the account rules, and is the sample large enough to support a conclusion? One red month answers none of them.
Do not change a strategy because it is losing. Change it when pre-defined evidence says its assumptions, execution or distribution have moved outside the tested range.
Conclusion
The professional response to a drawdown is neither blind faith nor immediate optimisation. It is a small, repeatable investigation: measure the path, compare it with the research, check the implementation, and take the action written in the playbook.
That is how an algorithm earns the right to continue — and how a broken version is retired before it consumes more capital.